To track the sales of your company access the Dashboard through clicking on the home icon on the bottom of your screen. Charts under the Overview section display the general sales data as per the period selected.
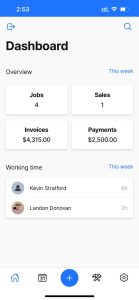
Here is how these charts show the data:
- Jobs: Jobs created in the selected period
- Invoices: Total amount of invoices of the jobs created in the selected period.
- Sales: Shows the number of jobs created in the selected period of which invoices are fully paid.
- Payments: Total amount of payments for the jobs created in the selected period.
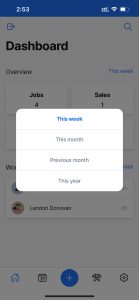
To change the selected period follow the steps below:
- Click on the current period.
- You will see the window opened.
- Choose the relevant period from the window and you will have the sales data changed according to the selected period.